Fleet cost isn't one big line item; it's the sum of dozens of small inefficiencies. That's both bad news and good news. The bad: you can't press one button and halve your cost. The good: every inefficiency is measurable, therefore closable. The seven leaks below make up the bulk of cost in most fleets — and each can be closed with data.
Cost you can't see, you can't cut
Before the seven items, a word on why fleet cost is so stubborn: most of it is invisible in day-to-day operations. A manager feels the big, lumpy costs — a lease payment, a major repair — but the largest total is usually the sum of small, continuous inefficiencies that never appear as a bill. Nobody sends you an invoice for the 12% of kilometers you didn't need to drive, or the 30% of vehicle capacity you shipped empty. That's the core insight behind every item below: these costs become cuttable only once they become visible. The role of a TMS here isn't to drive the truck differently — it's to turn invisible waste into a number on a dashboard, because a number is something you can set a target against.
1. Route inefficiency
Unoptimized routes mean unnecessary mileage — a direct cost in fuel and vehicle wear. Dynamic routing recalculates every trip against real conditions and is usually the fastest-returning item. Cutting a route 10% cuts the fuel budget 10%.
2. Low vehicle utilization
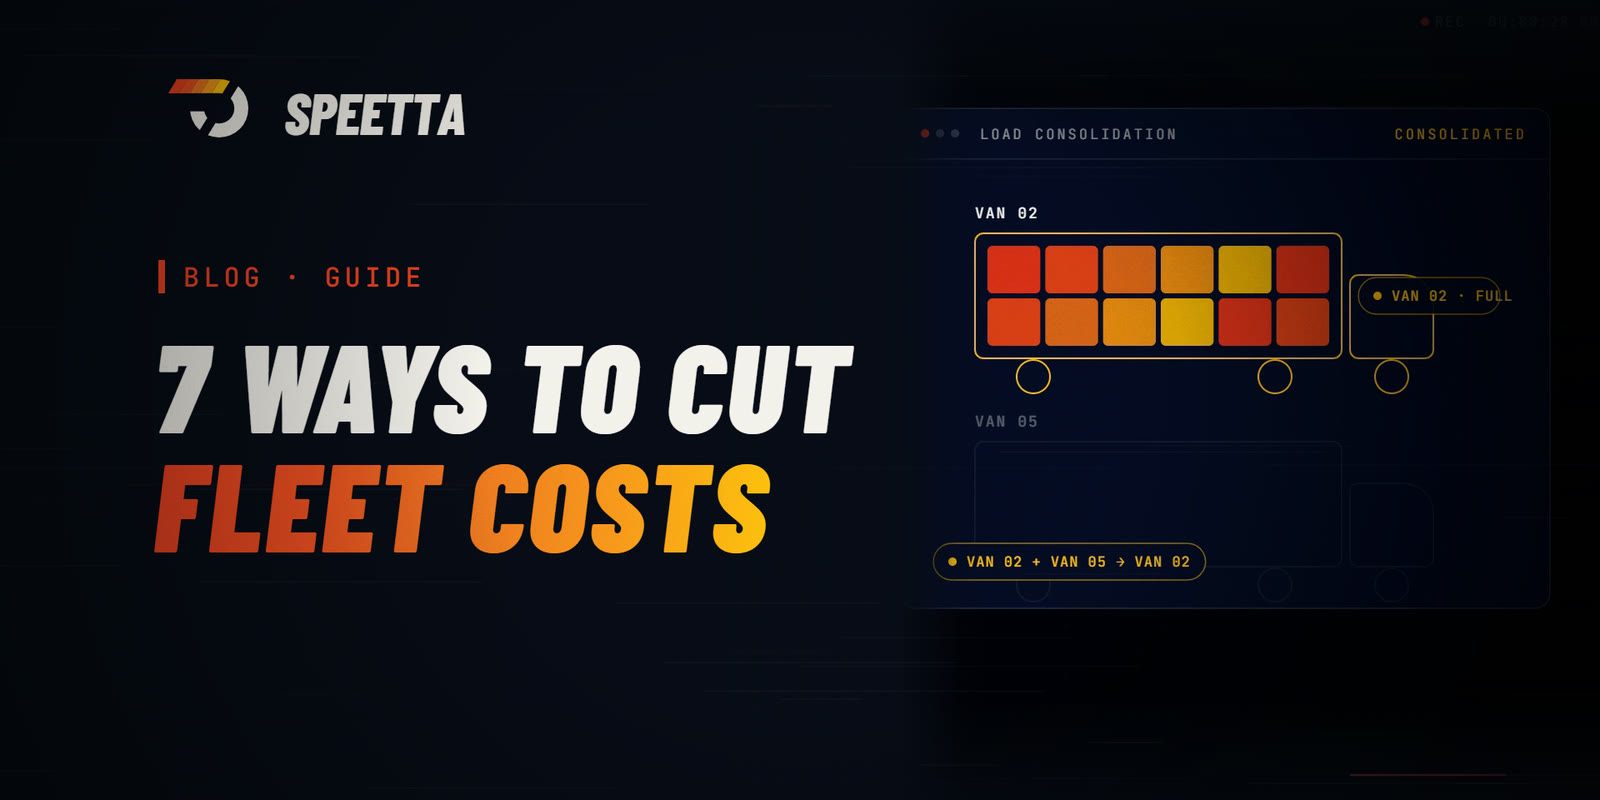
Half-empty trips split fixed cost across fewer parcels. Load balancing and multi-stop consolidation raise utilization, letting you do the same work with fewer vehicles. If you're not measuring utilization, it's probably lower than you think.
3. Idle driver time
Waiting, inefficient sequencing and backtracking burn driver hours. An optimized delivery order means more deliveries per driver — using the fleet's most expensive resource, human time, more efficiently.
4. Reactive maintenance
An unexpected breakdown costs twice: the repair, plus the delay and missed deliveries that vehicle causes. A planned maintenance schedule and alerts for expiring documents and inspections catch failures in the shop, not on the road. Predictable maintenance is always cheaper than an unpredictable breakdown.
There's a compounding angle here too. A vehicle that breaks down mid-route doesn't just cost its own repair and delay — it forces a scramble to redistribute its deliveries across other vehicles, disrupting their optimized routes and pushing the whole day off plan. One unplanned failure can degrade the efficiency of the entire fleet for a day. Shifting maintenance from reactive to scheduled removes not just the direct repair premium but this hidden ripple cost, which is often larger than the repair itself.
5. Failed deliveries
Every re-delivery is a trip cost from scratch. A realistic ETA and proactive customer communication raise the first-attempt delivery rate, closing this leak. Measuring the failed-delivery rate is the first "shock" metric for most operations.
6. Manual admin burden
Manual planning, data entry and reconciliation are an invisible but real labor cost. Calculate how many hours a week your team spends asking for shipment status and filling spreadsheets — the result is usually surprising. Automation gives those hours back and redirects the team to higher-value work.
7. Not measuring
The seventh and most fundamental leak: you can't improve what you don't measure. Dashboards for cost, delivery performance and service level show where the next saving is. Without measurement, you can't even tell which of the six items above is biggest for you.
Fixed vs variable: where the leverage really is
One framing makes prioritization far easier: separate every cost into fixed and variable. Fixed costs — vehicle leases, insurance, base salaries — don't change much with how you operate day to day, so the lever on them is utilization: the more productive work each vehicle and driver does, the lower the fixed cost per delivery. Variable costs — fuel, overtime, maintenance, failed-delivery re-runs — scale directly with how you operate, so the lever there is efficiency. The mistake many operations make is attacking variable costs (squeezing fuel, cutting overtime) while ignoring utilization, where the larger structural gain usually sits. If a vehicle runs at 70% utilization, raising it to 90% is often worth more than any single fuel-saving tactic, because it spreads the entire fixed base across more deliveries. Measure both, but when they compete, utilization usually wins.
Where to start: prioritization
Attacking all seven at once is an invitation to fail. Instead, measure first, then focus on the biggest leak. In most fleets the first three items (route, utilization, driver time) deliver the bulk of the gain, because they touch every trip. Maintenance and failed deliveries are usually "hidden" costs — they look small but add up.
Gartner's identification of automating routine tasks with AI as a defining trend in its 2026 TMS research points squarely at items six and seven: removing manual burden and deciding with data is now the competitive standard.
Cutting fleet cost doesn't come from one heroic move — it comes from a system that makes every leak visible.
Let's look at how Speetta measures these seven items in your own operation, and which is your biggest opportunity, in a demo.