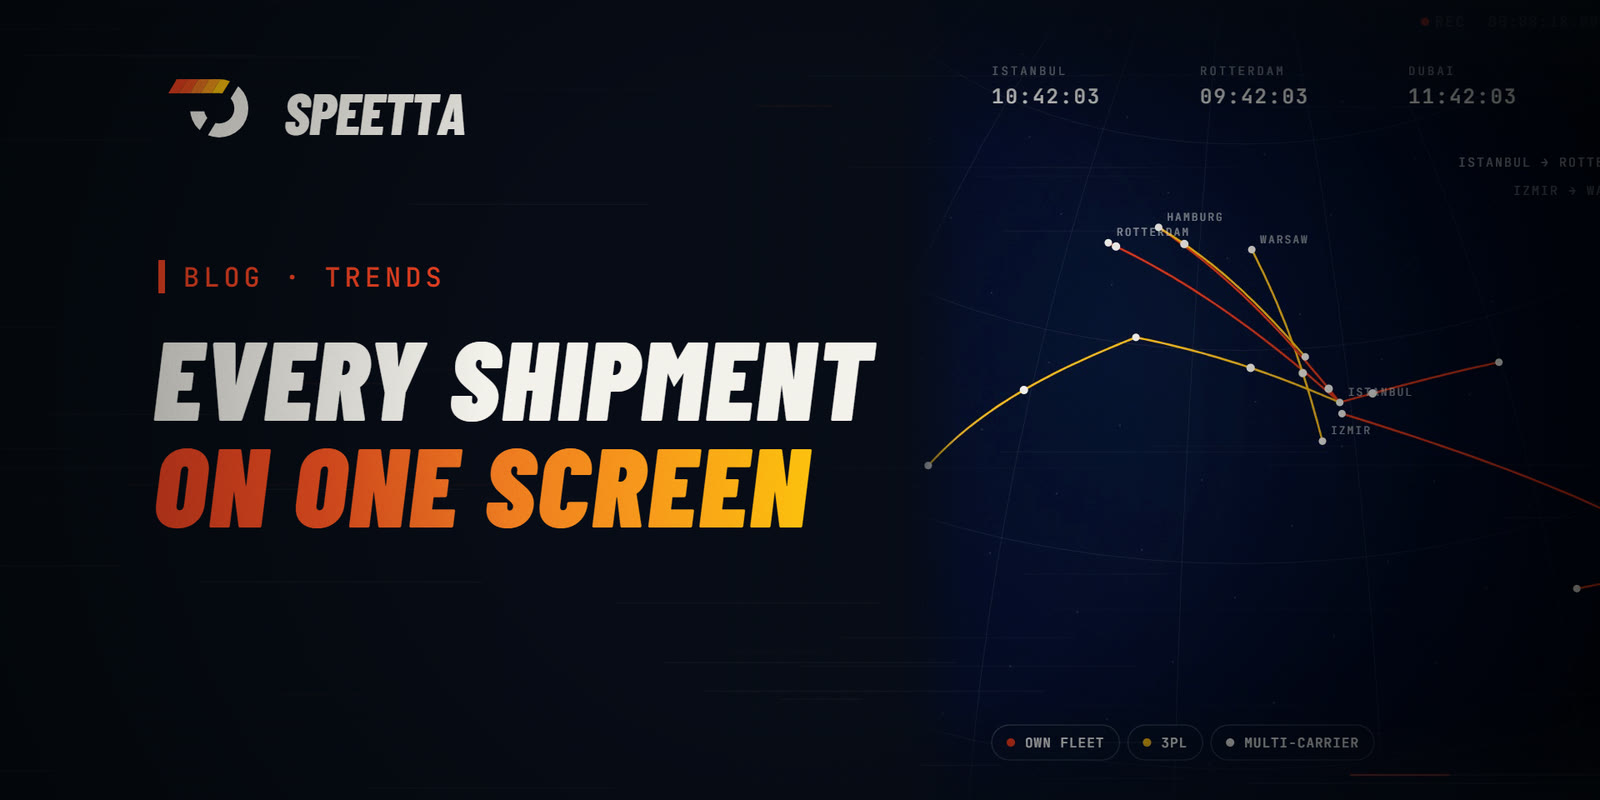
Knowing where a shipment is seems like a simple ask. But in a multi-carrier, multi-location operation, that information is scattered across dozens of systems: in a carrier's portal, on a driver's phone, in a warehouse worker's head. A control tower turns that scatter into a single screen of truth. And that's a far more strategic capability than it first appears.
A control tower is more than a map
Gartner defines a supply chain control tower as "a concept that combines people, process, data, organization and technology," capturing near real-time operational data across the business ecosystem to improve visibility and decision-making. As Gartner VP Analyst Christian Titze notes, a control tower isn't a standalone application but a capability embedded in a broader system: "an intelligent data platform providing use-case-specific insights, predictions and suggestions."
The practical meaning of that definition: a real control tower doesn't just show where vehicles are; it makes decisions possible. In Speetta's control tower this becomes:
- Live monitoring: Vehicles, shipments and ETAs are visible in real time.
- Dynamic assignment: Order tracking, vehicle assignment and driver management happen in one place.
- Demand forecasting: AI provides foresight for capacity planning and cost optimization.
- Multi-stop consolidation: Different shipments are combined into one trip.
- Geo-fencing: Zone restrictions are applied automatically for compliant routing.
The second-order effects of visibility
Real-time visibility answers more than "where." Its impact cascades. It catches delays early — you can intervene before the problem reaches the customer. It informs customers proactively — "where is it?" calls drop. It optimizes resource allocation — you see which vehicle is idle where. And perhaps most importantly, it makes every decision measurable — you know with data which carrier, route or zone performs well.
The sum of these effects moves the operation from reactive to predictive. A reactive operation solves problems after they surface; a predictive one sees them before they do.
Why is this a strategic priority now?
Real-time visibility's shift from "nice to have" to "must have" is an industry-wide trend. Gartner now formally tracks this space as its own market category — Real-Time Transportation Visibility Platforms (RTTVP) — describing it as "a key priority for shippers, logistics providers and their customers." A capability earning its own Magic Quadrant is the clearest sign it's no longer a niche feature but a baseline market expectation.
Three forces drive this shift: customer expectation (everyone expects Amazon-level tracking), operational complexity (more carriers, more locations) and cost pressure (optimization is impossible without visibility). Together they turned visibility from a luxury into core infrastructure.
The real obstacle to building a control tower
For most companies the obstacle isn't technology — it's data. A control tower is only as good as the data feeding it; if carriers, warehouse and field run on disconnected systems, the "single screen" dream becomes a fragmented picture. That's why a control tower is not a visualization project but an integration project. The real work is unifying data into one system of record; the screen is the easy part on top of that foundation.
You can't manage what you can't see. The control tower is the tool that moves logistics from guesswork to management.
What a control tower is worth
It's fair to ask what visibility actually returns, since it doesn't cut a cost as directly as, say, route optimization. The value shows up in second-order effects that are real but easy to overlook. Fewer "where is it?" calls give customer-service capacity back. Catching a delay early converts a failed delivery into a successful one, saving an entire re-run. Seeing idle capacity lets you reassign it instead of dispatching another vehicle. And measuring carrier performance turns your next contract negotiation from opinion into evidence. Individually each is modest; together they change the economics of the whole operation. Perhaps the clearest way to value a control tower is to price the alternative: the cost of decisions made blind — the vehicle sent when one was already nearby, the customer lost to silence, the carrier renewed despite chronic delays because no one had the data to say otherwise.
The real work is integration, not visualization
It's tempting to picture a control tower as a beautiful dashboard. But the dashboard is the last 10% of the work; the first 90% is connecting the data behind it. A control tower is only as complete as the sources feeding it — if one carrier's data arrives by email and another's by API, the "single screen" has a blind spot exactly where you're least likely to notice it. This is why control-tower projects that start with the interface tend to disappoint, while those that start with integration tend to last. The order matters: connect the sources into one system of record first, and the screen becomes almost trivial. Skip that step, and the prettiest dashboard in the world is just a prettier version of the fragmentation you already had.
From visibility to action: the maturity ladder
Not all control towers are equal, and it helps to think of visibility as a ladder with three rungs. The first rung is descriptive: it shows where things are right now. Most basic tracking tools stop here. The second rung is diagnostic: it explains why — which carrier, route or zone is causing the delay. The third and most valuable rung is prescriptive: it recommends what to do next, or acts automatically. A shipment is running late, so the system flags the affected customers, suggests a re-route, and reallocates the next delivery. The gap between rung one and rung three is the gap between a dashboard you watch and a system that works. When evaluating any control tower, the real question isn't "can it show me a map?" but "how far up this ladder does it go?"
Book a demo
Book a demo to see Speetta's control tower live and assess what visibility it would give your own operation.